Trusted by #37462 clients
  • Cutting Edge Technology
  • Global Regulated

    100% Safe Trading
  • for Best Service
a close up of a cell phone on a table
By - efexfx.world

Mastering Candlestick Charts: A Comprehensive Guide with Efexfx

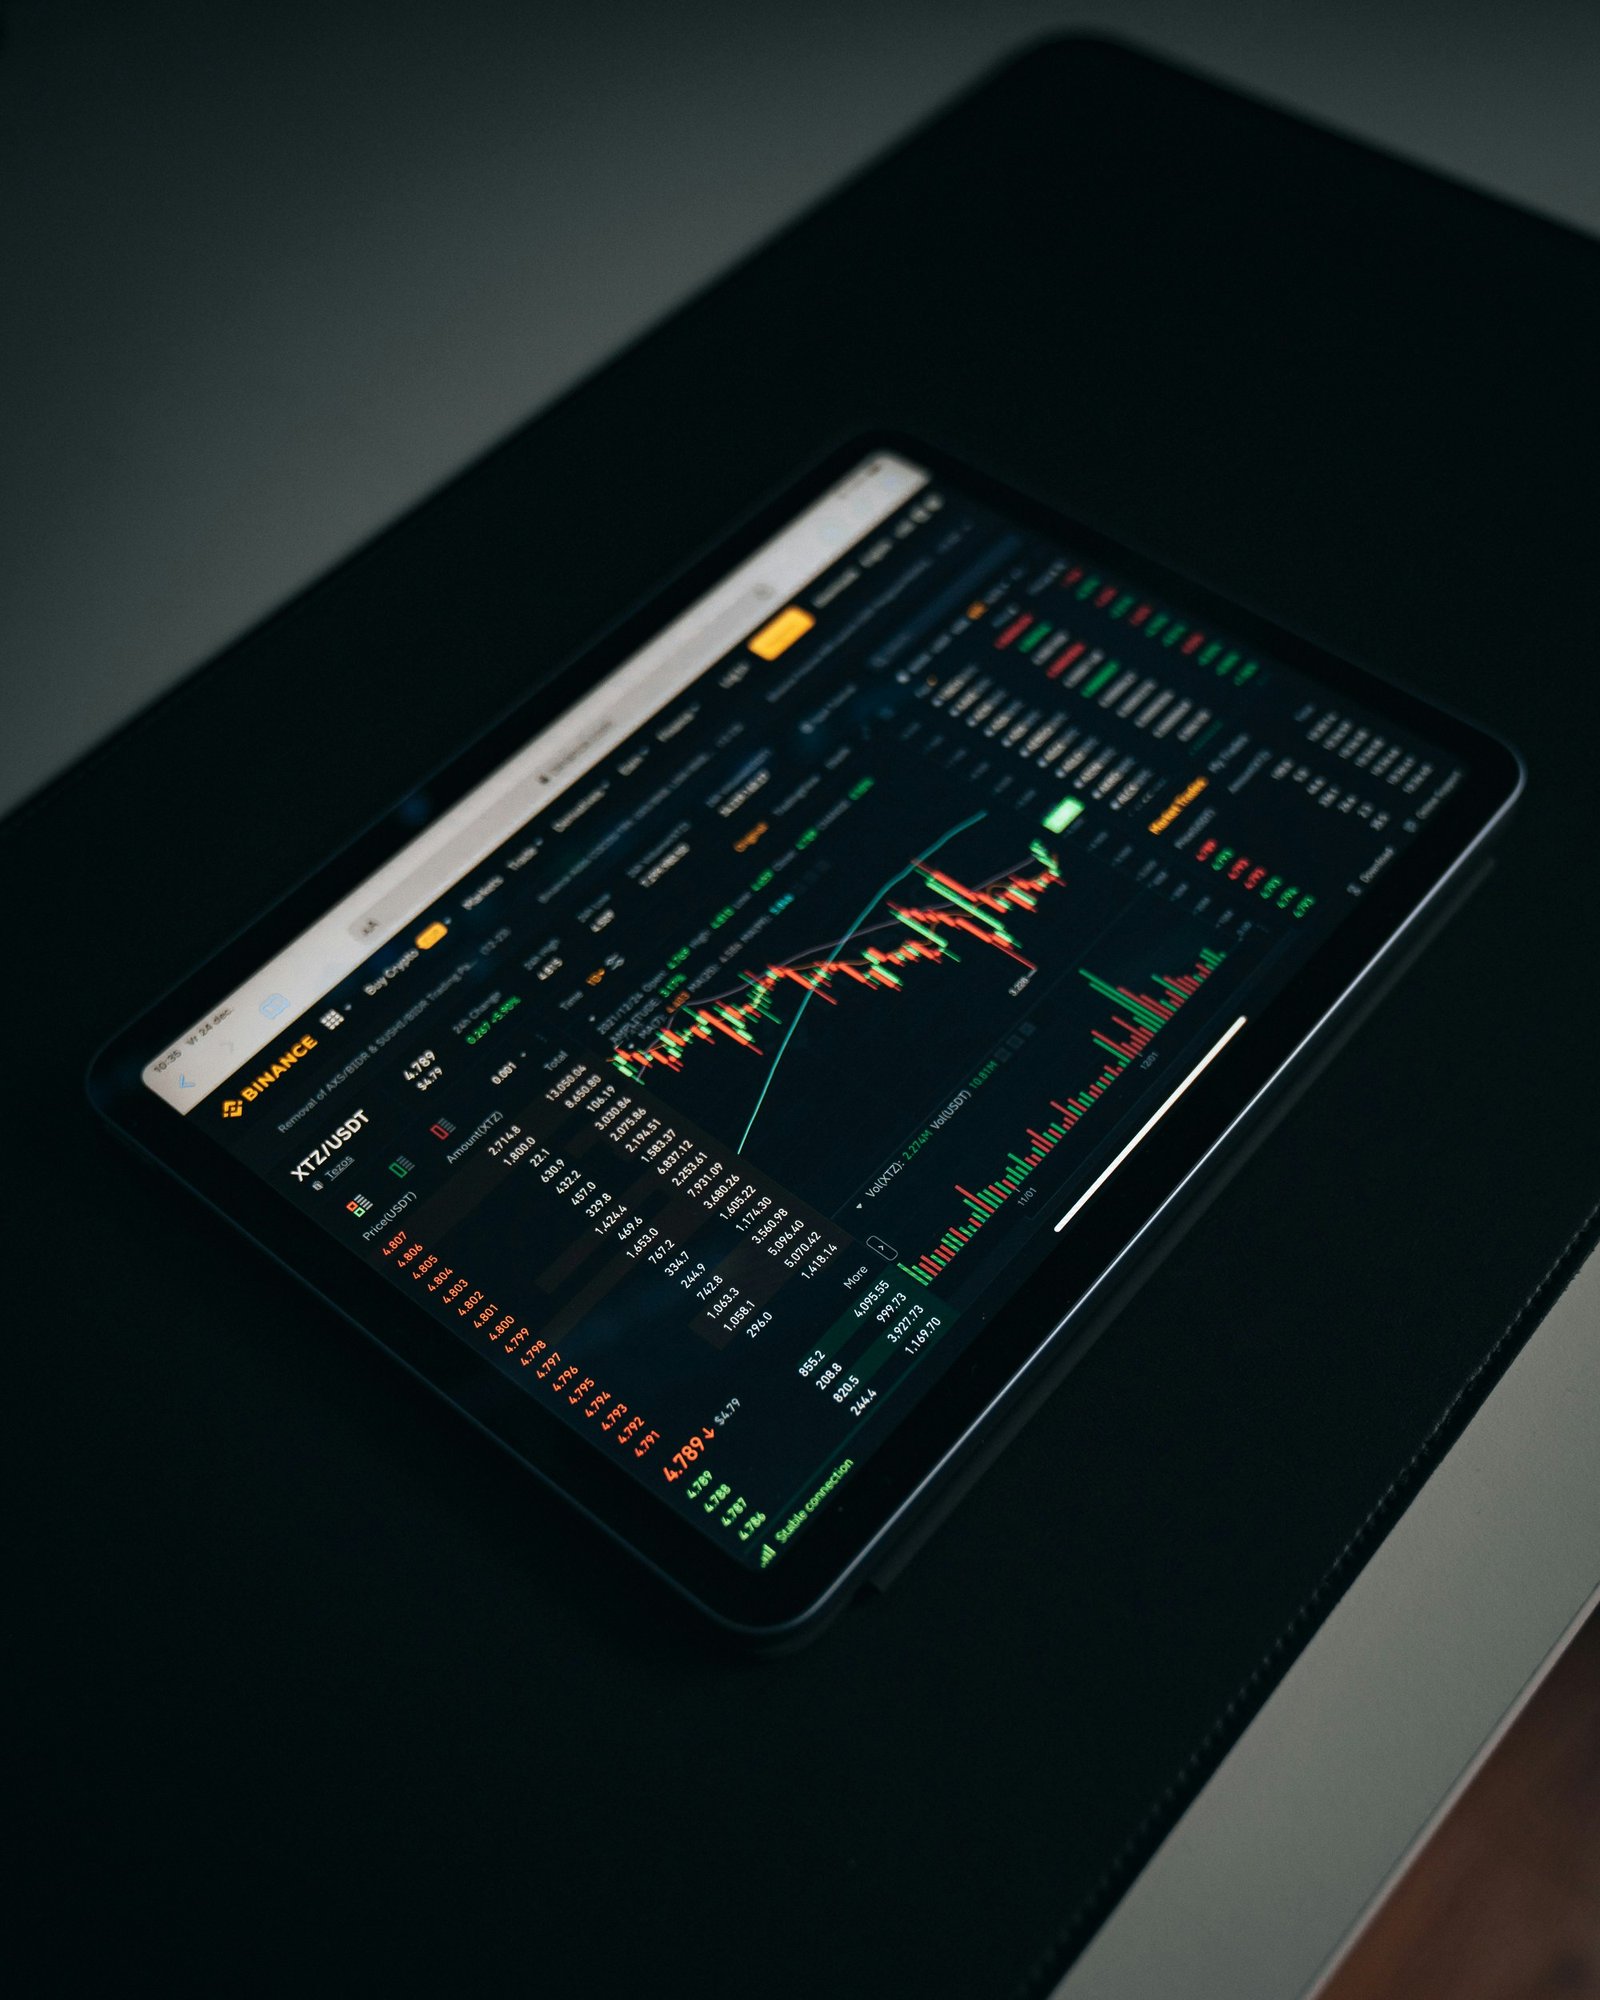
Introduction to Candlestick Charts Candlestick charts are a pivotal tool in the arsenal of traders across various financial markets, renowned for their ability to visually depict price movements over a specified period. Originating from 18th-century Japanese rice merchants, these charts have evolved to become a foundational component of modern technical analysis. Their utility lies in their straightforward representation of market

By - efexfx.world

Learn About Top Technical Indicators Available on EFEXFX Platform, Including SMA

Introduction to Technical Indicators Technical indicators are essential tools in the realm of trading, providing traders with the ability to analyze price movements, identify trends, and make informed trading decisions. These indicators are mathematical calculations based on the price, volume, or open interest of a security or contract. By interpreting these data points, traders can gain insights into market conditions,

turned on monitoring screen
By - efexfx.world

An Introduction to Technical Analysis in the Crypto Market

Technical analysis is a method used by traders and investors to forecast future price movements based on historical market data. It involves studying patterns, trends, and indicators to identify potential buying or selling opportunities. The goal of technical analysis is to predict price movements and make profitable trades. There are several key principles that form the basis of technical analysis.